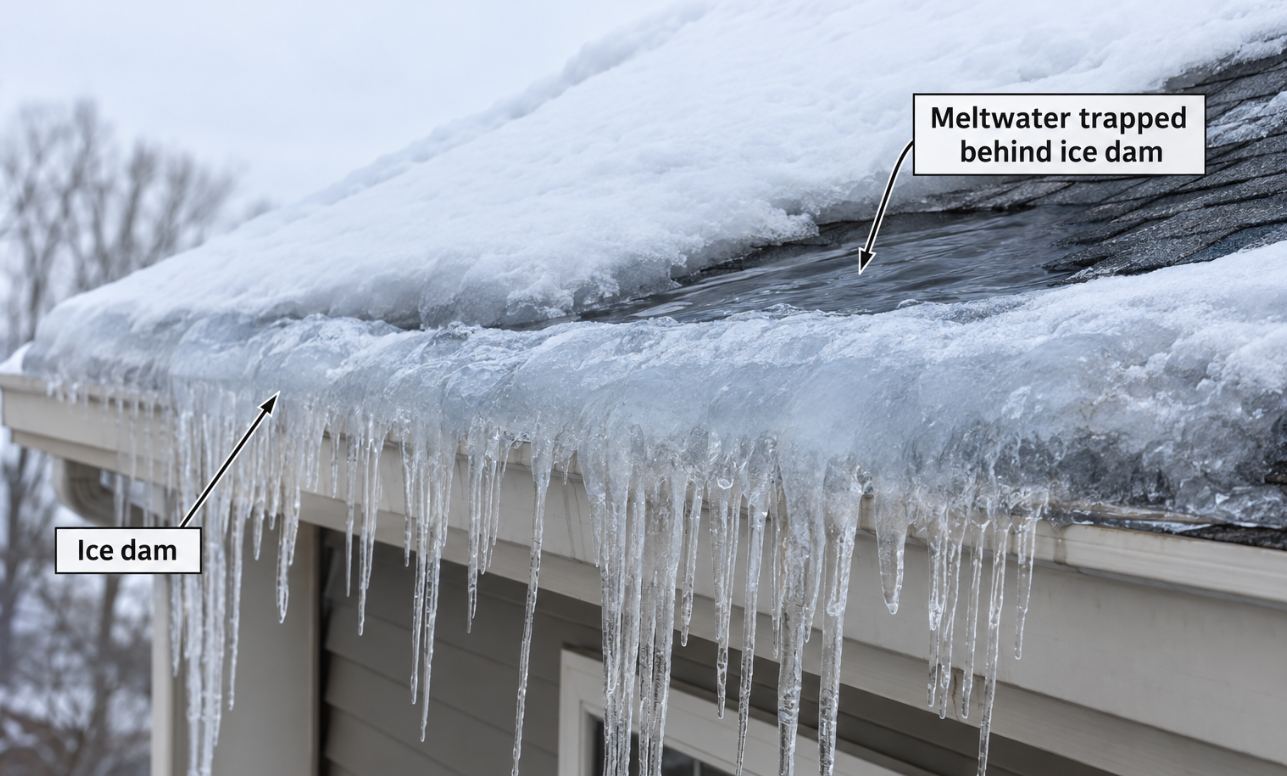
Ice dams form when heat escaping a home melts snow near the roof peak and that water refreezes at the cold eave. Poughkeepsie averages about 33 inches of snow a year with roughly a third of winter days holding snow on the ground, and nearly 18 percent of Dutchess County homes predate 1940, a combination that makes ice dams a leading cause of winter roof damage here.
Ask most Dutchess County homeowners what causes roof damage, and they’ll mention storms, wind, or simple aging. Ice dams rarely make the list, even though they account for a significant share of winter roof repair calls across the Hudson Valley every year.
How an Ice Dam Forms
An ice dam forms when heat escapes unevenly from a home’s living space and melts snow near the roof’s peak, while the eaves, which extend beyond the heated wall line, stay cold enough for that meltwater to refreeze right at the edge.
Why Ice Dams Form So Readily in This Region
The Hudson Valley’s genuine winter cold, combined with the region’s typical snowfall accumulation, creates exactly the conditions this cycle needs, and it can repeat multiple times across a single winter as temperatures swing through freeze-thaw stretches.
The local snow pattern matters more than the seasonal total. January alone averages about 11.6 inches across 4.7 snow days, and February adds about 8.3 inches. Roughly four days a year bring at least three inches of new snow. That means snow sits on roofs repeatedly through the coldest stretch of the year rather than arriving in one big event and melting off.
Snow that lingers is what feeds an ice dam. Every thaw cycle produces meltwater at the warm part of the roof and a refreeze at the cold edge.
Why the Damage From an Ice Dam Isn’t Always Obvious Right Away
Once an ice dam has formed, the backed-up water it creates can work its way under shingles, and that intrusion doesn’t always announce itself immediately as an interior leak.
It can sit quietly, saturating underlayment, decking, and insulation, for weeks or even an entire season before a homeowner notices a stain on a ceiling or ice buildup visible from the ground.
This delay is a big part of why ice dam damage often gets discovered well after the actual event that caused it, sometimes not until the following winter when the same conditions repeat and finally push the damage to a visible point.
Why Older Dutchess County Homes Are Particularly Vulnerable
A meaningful share of housing throughout the Hudson Valley predates modern attic insulation and ventilation standards, which means these homes are more likely to have the uneven heat loss that drives ice dam formation in the first place.
The county’s housing data backs this up. The median Dutchess County home was built in 1971, but 17.9 percent of homes date to 1939 or earlier, and roughly 22 percent predate 1950. That is more than 27,000 homes built before attic insulation and balanced ventilation were standard practice.
This isn’t a reflection of poor maintenance. It’s simply a function of when the home was built relative to when current insulation and ventilation practices became standard.
| Era Built | Share of Dutchess County Homes | Typical Ice Dam Risk Factors |
|---|---|---|
| 1939 or earlier | 17.9% | Little original insulation, few or no soffit vents, knee walls and complex rooflines |
| 1940 – 1959 | 16.6% | Thin insulation by current standards, unbalanced ventilation |
| 1960 – 1979 | 29.2% | Some insulation, often below today’s R-values; air sealing rarely addressed |
| 1980 or later | 36.2% | Better baseline, but added recessed lights and attic conversions can create hot spots |
Why Fixing the Roof Surface Without Addressing Attic Issues Doesn’t Solve the Problem
If a roof repair only replaces the shingles or membrane damaged by a specific ice dam event, without also addressing the attic insulation and ventilation imbalance that caused the ice dam to form, the exact same problem is likely to repeat on the newly repaired section during the next comparable winter.
This is worth discussing directly with whoever’s handling a repair: are they treating the visible symptom alone, or actually investigating and correcting the underlying heat-loss pattern.
What Signs Point Specifically to Ice Dam-Related Damage
A few patterns are worth watching for, particularly heading into or coming out of winter:
- Icicles forming consistently along the same section of roofline, rather than evenly across the whole eave, which points to a specific localized heat-loss area
- Visible ice ridges building up at the roof’s edge during or after a snow event
- Ceiling stains that appear specifically after a thaw following a snowy stretch, rather than during active rainfall
- Damp or discolored insulation in the attic directly beneath areas where ice has been observed forming outside
- Snow that melts off one section of roof well before the rest, which marks where heat is escaping
Why a Proper Assessment Looks at the Attic, Not Just the Roof Surface
A thorough evaluation after suspected ice dam damage should include checking attic insulation levels, confirming ventilation is balanced between intake at the soffits and exhaust at the ridge, and inspecting the roof deck and underlayment for saturation that may not be visible from inside the living space yet.
| What to Check | What a Good Inspection Finds |
|---|---|
| Insulation depth and coverage | Thin spots, compressed batts, gaps at the eaves where insulation blocks airflow or stops short |
| Air sealing | Leaks at recessed lights, bath fans, chimney chases, attic hatches, and top plates |
| Ventilation balance | Whether soffit intake matches ridge exhaust, and whether intake vents are blocked |
| Deck and underlayment | Staining, delamination, or soft decking near the eaves |
| Ice barrier coverage | Whether a membrane was installed at the eaves and how far up the slope it runs |
| Duct and equipment leaks | HVAC ducts or bath fans discharging warm, moist air into the attic |
What Prevention Costs Compared to Damage
The spending gap is the practical argument for addressing the cause. Removal buys time for one winter. Insulation and air sealing change the conditions that create the dam.
| Item | Typical 2026 Cost | What It Does |
|---|---|---|
| Professional steam removal | $300 – $600 per hour, most jobs 2 – 4 hours | Clears an existing dam without damaging shingles |
| Emergency removal, active leak | $500 – $800 per hour | Same work at urgency pricing |
| Heat cables | $500 – $1,500 installed, $100 – $300 per winter to run | Manages symptoms at problem spots; not a fix for heat loss |
| Air sealing | $500 – $1,500 | Stops the warm air leaks that drive uneven melting |
| Attic insulation upgrade | $1,500 – $3,000 to reach R-49 or R-60 | Keeps attic temperature closer to outside air |
| Interior water damage, minor | $500 – $2,000 | Ceiling stains, small drywall and paint repairs |
| Interior water damage, moderate | $2,000 – $8,000 | Wet insulation, drywall replacement, possible mold work |
| Interior water damage, severe | $8,000 – $25,000+ | Decking, framing, extensive interior restoration |
Code and R-Value Benchmarks Worth Knowing
| Item | Benchmark |
|---|---|
| Ice barrier at the eaves | Required where there is a history of ice forming at the eaves. It runs from the lowest edge of the roof to at least 24 inches inside the exterior wall line, using either two cemented layers of underlayment or a self-adhering polymer-modified bitumen sheet. |
| Attic insulation | Dutchess County sits in a cold climate zone where current energy code points to about R-60, with R-49 accepted in some raised-heel truss assemblies. Many older homes here fall well short of either. |
| Attic ventilation | One square foot of net free ventilating area per 150 square feet of attic floor, improving to 1:300 when the area is properly split between low intake at the eaves and high exhaust, with an adequate vapor retarder. |
| Balance over volume | Intake and exhaust separated vertically move far more air than vents clustered in one area. Net free area is smaller than a vent’s measured size because screens cut airflow. |
| Permits | Each town and city in Dutchess County runs its own building department. Confirm requirements for your address before a reroof. |
To size a project or compare quotes, measure the roof with our roof square footage calculator.
Getting a Repair That Actually Addresses the Root Cause
Because ice dams trace back to attic conditions as much as the roofing material itself, a repair that only replaces damaged shingles without correcting the underlying heat-loss pattern is treating a symptom rather than the actual problem.
Roof repair in Dutchess County that includes a real look at attic insulation and ventilation, not just the visible roof surface, is what actually prevents the same ice dam from causing repeat damage next winter.
Why This Matters for Planning, Not Just Reacting
If your home has shown any of these ice dam warning signs in a previous winter, it’s worth having this evaluated before the next cold season rather than waiting for a repeat event to force the issue. Insulation and air sealing work is easier to schedule in fall than in the middle of a January thaw, and it is far cheaper than the interior repairs that follow a leak.
Frequently Asked Questions
What causes ice dams on a roof?
Heat escaping unevenly from the living space melts snow near the roof’s peak. That meltwater runs down to the eaves, which extend past the heated wall line and stay cold enough for it to refreeze. The resulting ridge of ice blocks further runoff, and water backs up under the shingles.
Why are ice dams so common in the Hudson Valley?
Poughkeepsie averages about 32.8 inches of snow a year across roughly 13.5 snow days, and snow sits on the ground for about a third of winter days. Repeated freeze-thaw swings through January and February give the melt-and-refreeze cycle many chances to repeat in a single winter.
How soon does ice dam damage show up inside the house?
Often not for weeks, and sometimes not within the same season. Water that gets under the shingles can saturate underlayment, decking, and insulation quietly before a ceiling stain appears, which is why damage is frequently discovered long after the event that caused it.
Why are older Dutchess County homes more at risk?
About 17.9 percent of Dutchess County homes were built in 1939 or earlier, and roughly 22 percent predate 1950. These homes were built before modern attic insulation and balanced ventilation were standard, so they are more likely to have the uneven heat loss that drives ice dam formation.
Will replacing damaged shingles stop ice dams from coming back?
Usually not on its own. If the attic insulation and ventilation imbalance that caused the dam is not corrected, the same problem tends to repeat on the newly repaired section during the next comparable winter.
What are the warning signs of an ice dam problem?
Icicles forming repeatedly along one section of roofline rather than evenly, ice ridges at the roof edge after snow, ceiling stains that appear after a thaw rather than during rain, damp or discolored attic insulation beneath those spots, and snow melting off one section of roof well before the rest.
How much does ice dam removal cost?
Professional steam removal typically runs $300 to $600 per hour, with most jobs taking two to four hours. Emergency calls with active leaking can run $500 to $800 per hour. Removal clears the existing dam but does not address the heat loss that created it.
Is it cheaper to fix the attic or keep removing ice dams?
Fixing the cause usually costs less over a few winters. Air sealing commonly runs $500 to $1,500 and an insulation upgrade to R-49 or R-60 runs about $1,500 to $3,000, both one-time costs. Repeated removal is a recurring seasonal expense, and interior water damage ranges from $500 for minor stains to $25,000 or more in severe cases.
Do heat cables solve ice dams?
They manage symptoms at specific problem areas rather than fixing the cause. Installation typically runs $500 to $1,500 with $100 to $300 per winter to operate. They can be useful on difficult rooflines, but they do not reduce the heat loss driving the melt.
What is an ice barrier and is it required?
An ice barrier is eaves protection installed under the roof covering where there is a history of ice forming at the eaves. It extends from the lowest edge of the roof to at least 24 inches inside the exterior wall line, using either two cemented layers of underlayment or a self-adhering polymer-modified bitumen sheet.
Free Roofing Calculators
Sources
- Current Results, Poughkeepsie NY snowfall totals and accumulation averages (Dutchess County Airport records)
- Point2Homes, Dutchess County NY housing age demographics (American Community Survey data)
- RoofVista, Ice Dam Prevention and Repair Guide (2026): removal, heat cable, insulation, air sealing, and water damage costs
- Building Enclosure, Roofing Codes: Ice Barriers (IRC R905.1.2 extent and materials)
- RemodelCalculators, IECC Climate Zone 5 Insulation R-Value Requirements
- AtticShield, attic ventilation guide (1:150 and 1:300 ratios, balanced intake and exhaust, net free area)
Disclaimer: Costs, code benchmarks, and climate figures in this guide are 2026 estimates compiled from published contractor, government, and climate sources for planning purposes only. Code requirements and permit rules vary by town and are enforced locally. Confirm requirements with your building department and get written assessments from licensed, insured roofing and insulation contractors.